From Dashboards to Decisions: Making Analytics Actually Useful
Most organisations have more dashboards than decisions. This is how to tie every report to an owner and an action, define metrics once so the numbers agree, and retire the reporting nobody actually uses.
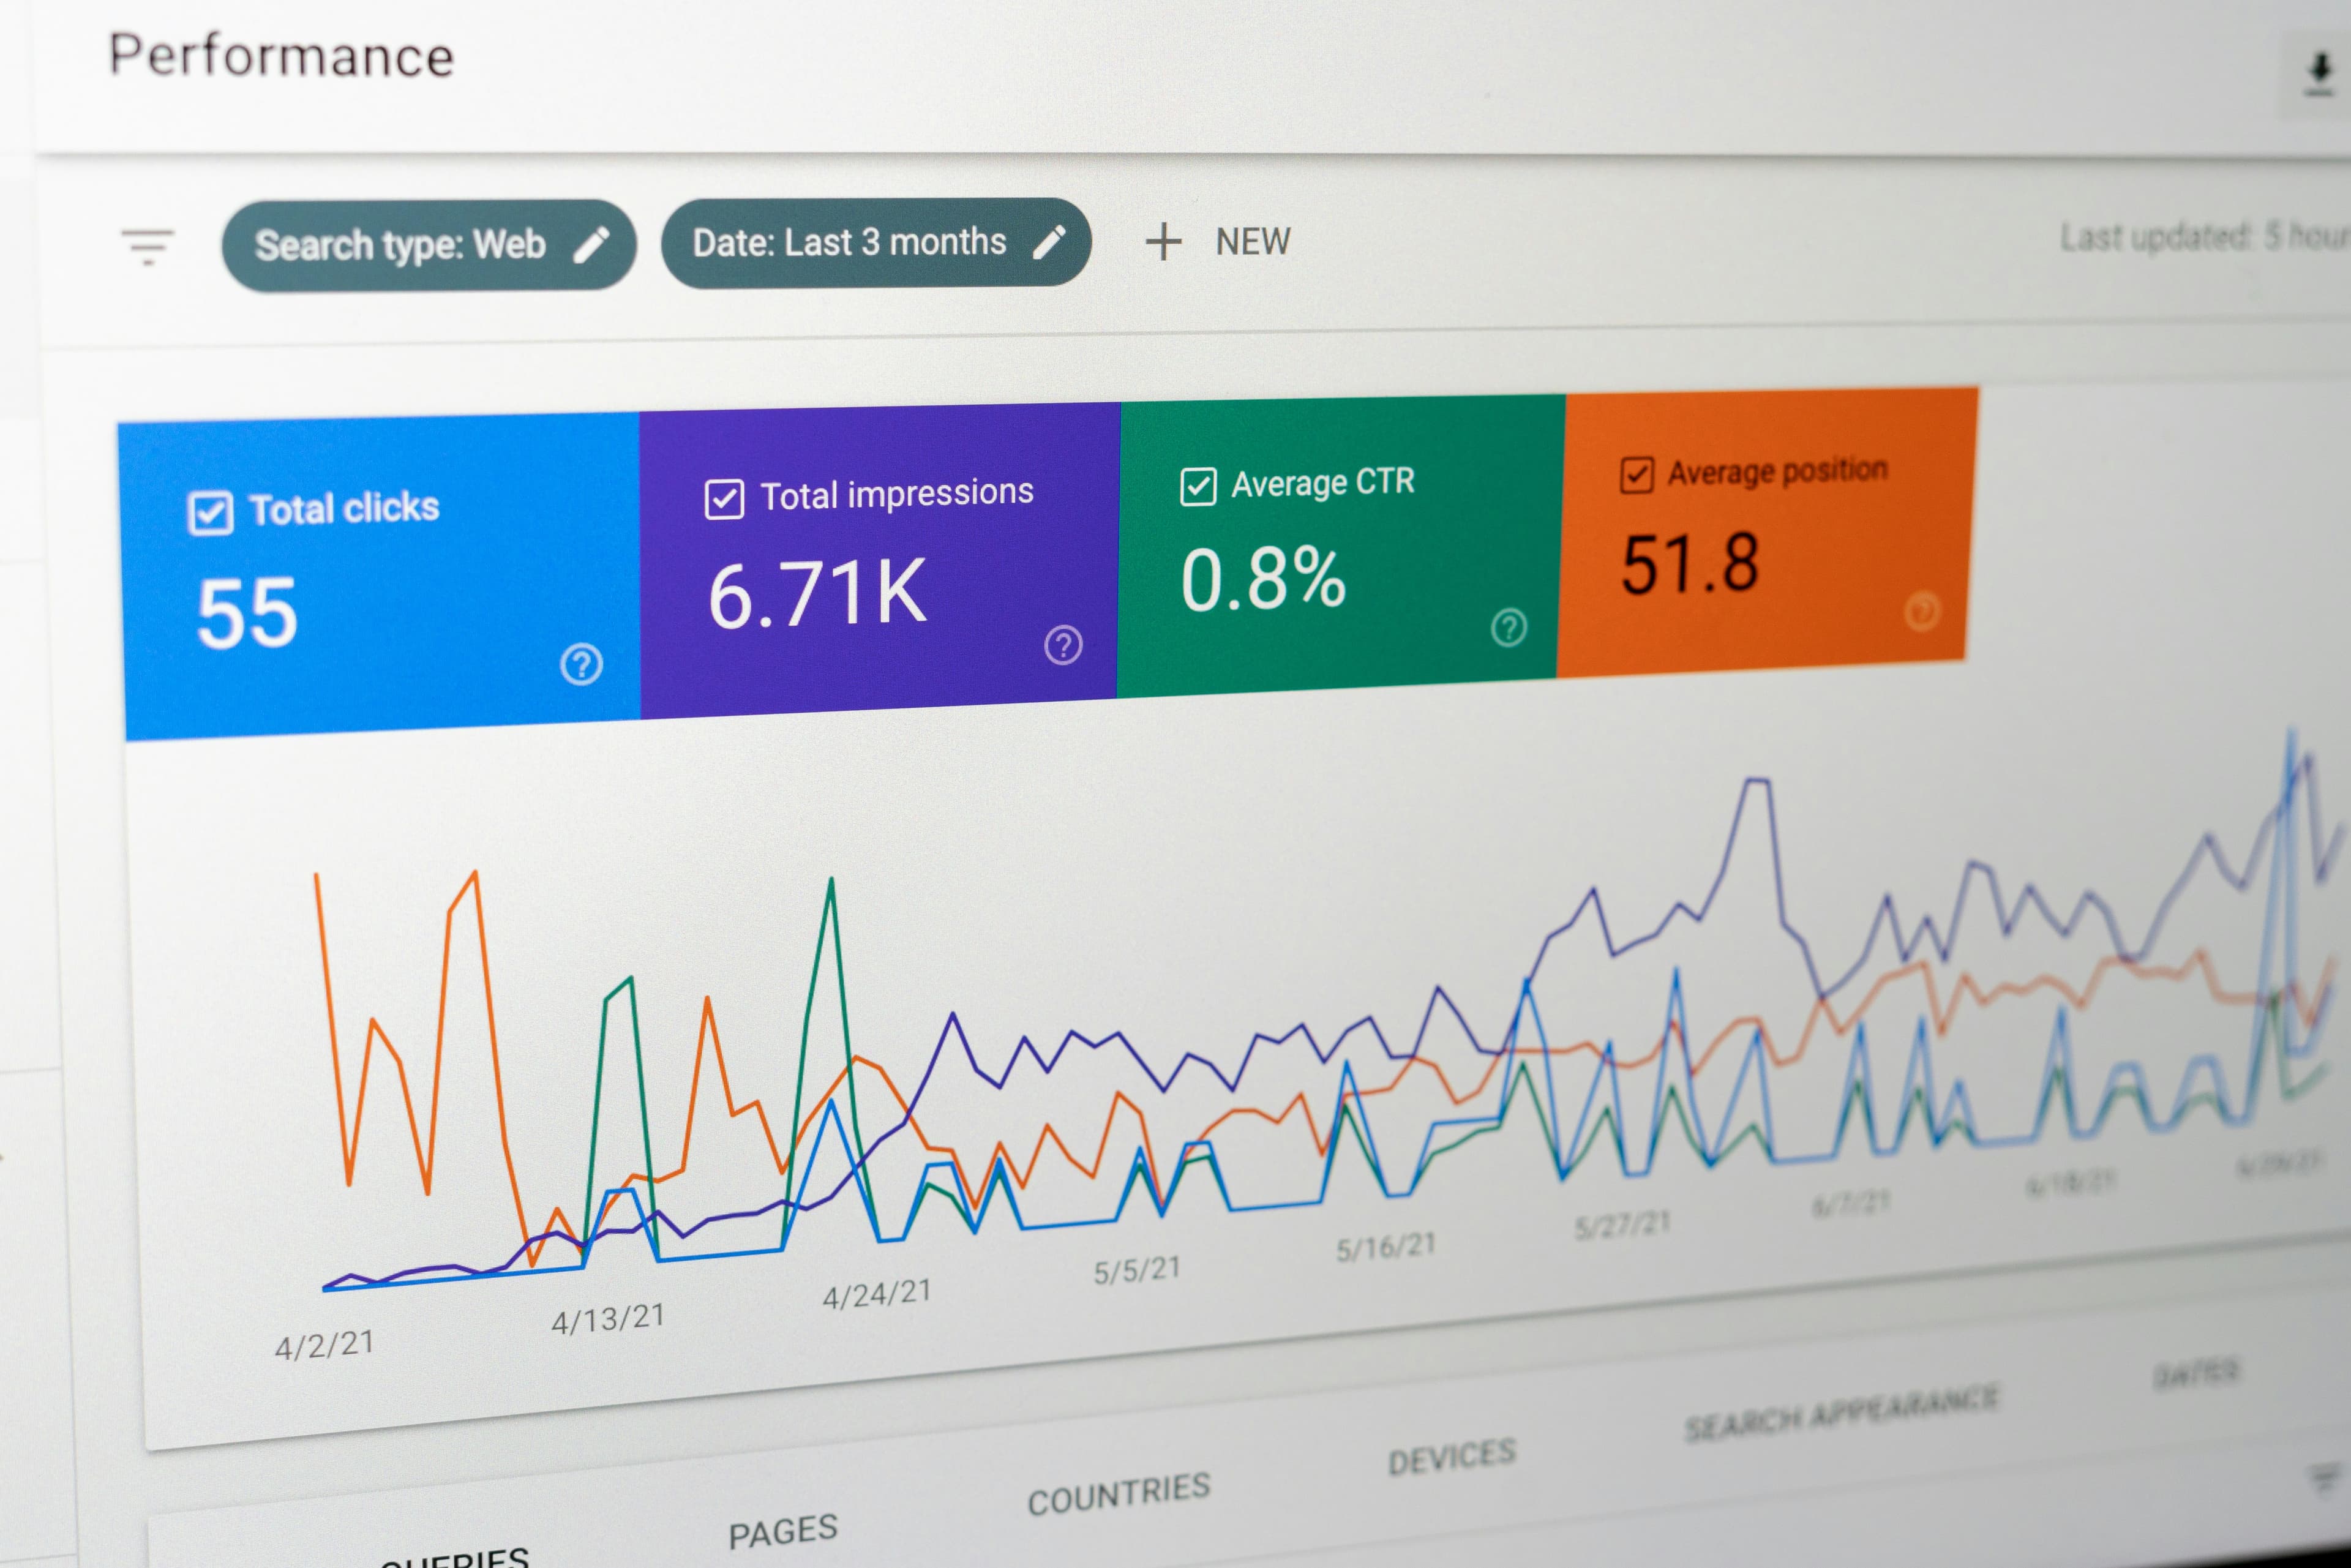
Almost every organisation we work with has more reporting than it can act on. The problem is rarely the tooling. It is that dashboards get built to answer a question somebody once asked, then outlive both the question and the person who asked it.
Every metric needs an owner and an action
A useful discipline: for each metric on a dashboard, name the person who acts on it and the decision it changes. Metrics that fail this test are context at best and noise at worst, and they should move off the main view.
This single rule tends to cut a reporting suite by half, and the half that survives gets looked at far more often. Attention is the scarce resource, not data.
- Who owns this number?
- What decision does it change, and how quickly?
- What threshold would make us act differently?
Define each metric once, centrally
The most common cause of distrust in reporting is two teams presenting different values for the same word. Revenue, active customer, churn and pipeline all have several defensible definitions, and if each dashboard encodes its own, arguments about the data replace decisions based on it.
A shared semantic layer — a single place where each business metric is defined in code and reused everywhere — is unglamorous plumbing that pays for itself the first time a leadership meeting stops arguing about whose number is right.
A metric that two teams calculate differently is not a metric. It is a disagreement with a chart on top.
Make freshness and quality visible
Users trust reporting they can interrogate. Show when the data last loaded, flag partial loads, and surface known gaps rather than hiding them. A dashboard that admits it is four hours stale is more useful than one that silently shows yesterday.
Automated checks belong in the pipeline, not in someone's memory: row-count deltas, null-rate thresholds and referential checks catch most breakages before a person notices something looks odd.
- Timestamp every view with its last successful load.
- Alert on volume and null-rate anomalies, not just hard failures.
- Publish a short, honest list of known data gaps.
Retire reporting on a schedule
Dashboards accumulate. Instrument usage, review it quarterly, and archive anything nobody has opened in ninety days. Nothing is truly lost — the definitions live in the semantic layer — and the remaining views stay fast, trusted and worth maintaining.
Key takeaways
- Tie every metric to an owner and a decision, or take it off the dashboard.
- Define business metrics once, in a shared layer, and reuse them everywhere.
- Show data freshness and known gaps rather than hiding them.
- Archive unused reporting quarterly so the surviving views stay trustworthy.